Abstract: This study examines the relationship between the level of automation in warfare and combat effectiveness, focusing on unmanned combat systems (UCS). As the Republic of Korea faces a significant decline in the availability of military personnel due to demographic changes, UCS adoption has become a critical priority. While UCSs are anticipated to surpass human combatants in operational efficiency, they require substantial maintenance and repair resources. Using an agent-based model adapted from ecological frameworks, this study simulates conflict scenarios involving two opposing groups. Simulation results show that UCS units consistently outperform human combatants and play a substantial role in reducing the duration of conflict. These findings highlight the complex interplay between UCS, human soldiers, and maintenance personnel, suggesting that simply augmenting the combat effectiveness of human troops does not necessarily guarantee victory.
Problem statement: What is the optimal ratio between human combatants and USCs to maximise combat effectiveness, considering the advantages and limitations of each?
So what?: The deployment of UCS not only addresses the problem of manpower shortages but also contributes to shortening the duration of armed conflict. Furthermore, ensuring an adequate level of human combatants can enhance the overall effectiveness of UCS integration.
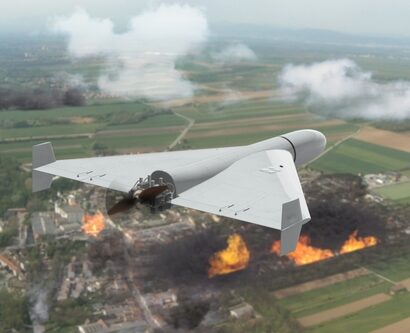
Source: shutterstock.com/Mike Mareen
Unmanned Combat Systems and Warfare
Advances in science and technology, along with a shrinking pool of military personnel—especially in countries like the Republic of Korea (ROK)—have increased the need to incorporate Unmanned Combat Systems (UCS) into modern warfare. The advantages and limitations of UCS are well documented. On the one hand, these systems offer superior combat efficiency compared to human soldiers and significantly reduce the risk of battlefield casualties. On the other hand, they are susceptible to mechanical failures and require more personnel for maintenance and logistical support. More broadly, the adoption of new military technologies typically entails not only an expansion of maintenance and support personnel, but also—particularly in the case of systems grounded in advanced science and technology, such as UCS—a growing demand for highly educated and technically specialised human resources.
ROK has demonstrated a strong interest in the deployment of UCSs due to the persistent military threat posed by the Democratic People’s Republic of Korea (DPRK) and the country’s rapidly declining population. While combat simulations based on single engagements can provide insights into UCS combat efficiency, they remain limited in their ability to predict overall war outcomes. Integrating UCSs into military operations reduces the number of human combatants required in battle. However, this benefit is counterbalanced by the increased need for highly skilled personnel to maintain and repair UCS units. Furthermore, in the context of protracted warfare—comprising multiple successive battles—it is essential to account for the redeployment of injured human soldiers and repaired UCS units.
While combat simulations based on single engagements can provide insights into UCS combat efficiency, they remain limited in their ability to predict overall war outcomes.
To conduct war simulations, this study employs an agent-based model (ABM) approach first developed in the field of ecology. The battlefield is conceptualised as a space occupied by two opposing forces, each composed of machines (M), human combatants (Hb), and maintenance personnel (Hm). Interaction rules among these entities are established, and differential equations are formulated to model the temporal dynamics of each component. The battlefield environment is assumed to be isolated, meaning that no external reinforcements are introduced, initial conditions constrain the maximum number of each entity, and engagements occur sequentially. War is deemed to conclude when the number of one faction’s forces converges to zero.
To parameterise the interactions that influence the temporal dynamics of each entity, various scenarios are constructed. The findings of the simulation analyses are twofold. First, strengthening UCS forces contributes more positively to both war outcomes and the duration of conflict than simply increasing the number of human combatants. In some scenarios, expanding human resources even led to defeat, suggesting that an overreliance on manpower can, under certain conditions, be strategically disadvantageous. Second, the findings indicate that a force composition strategy emphasising the integration of UCS with human combatants is more effective than a substitution-based approach. Specifically, when UCS were strengthened in tandem with human forces, the duration of war was reduced by nearly half compared to scenarios in which UCS were deployed as replacements for human combatants alone.
The Necessity of War Simulation
The ROK is undergoing a rapid demographic transformation, posing significant challenges to the mobilisation of military personnel necessary for national defence. As of 2024, the country’s total fertility rate stands at 0.63, indicating a severe population decline and ageing trend.[1] In 2022, the ROK’s active military personnel numbered approximately 500,000, with the country relying on a conscription system for male citizens in their twenties.[2] Since the outbreak of the Korean War in 1950, the ROK and DPRK have remained in a state of heightened military tension. According to the ROK Defence White Paper 2022, the DPRK maintains an active force of approximately 1.28 million personnel. Additionally, although the DPRK’s military is equipped with dated weapons systems, it possesses nearly twice the number of artillery pieces, armoured vehicles, tanks, naval warships, and fighter aircraft compared to the ROK.
The ROK is undergoing a rapid demographic transformation, posing significant challenges to the mobilisation of military personnel necessary for national defence.
Given the ROK’s demographic challenges and the persistent threat posed by the DPRK’s conventional military forces, the ROK Armed Forces have shown increasing interest in the deployment of UCS. Even in cases wherein demographic decline and severe security threats are not immediate concerns, advancements in science and technology have significantly influenced modern military strategy, making UCS deployment a prominent topic in recent military studies.[3] The advantages and disadvantages of UCS adoption, particularly for reducing reliance on human combatants, are being widely discussed. One of the primary advantages of UCS is its superior reconnaissance and lethality compared to human combatants. Recent combat simulations conducted in the ROK suggest that a single UCS unit can effectively perform the roles of two to three human soldiers.[4] Consequently, UCS deployment can significantly reduce the number of human personnel required in combat, thereby decreasing battlefield casualties. However, integrating UCS into military operations is not without its challenges. One of the most significant operational drawbacks is the increased human resources required for UCS control, maintenance, and repair.[5] This issue becomes particularly critical as more advanced UCS models necessitate a larger pool of highly skilled personnel for upkeep. In some cases, the additional personnel required for UCS maintenance may offset the manpower reduction achieved through UCS deployment.
Assessing the impact of UCS deployment based on one-time battle simulations is inherently limited. While such simulations are useful for evaluating UCS mobility and lethality compared to human combatants, they are insufficient for predicting overall war outcomes. The fundamental objective of UCS deployment is to enhance the likelihood of victory in war, a culmination of successive battles rather than a single engagement.[6] The necessity of war simulations arises from the dynamic nature of warfare, where multiple engagements determine overall success or failure. Among the critical factors influencing the outcome of prolonged warfare are human casualties, injuries, UCS malfunctions, and system losses. While deceased personnel and destroyed UCS units cannot be redeployed, injured soldiers and partially damaged UCS units may be reintroduced into combat through medical treatment and rehabilitation and repair and maintenance, respectively. However, this dynamic interplay between force attrition and resource regeneration underscores why single-battle simulations fail to capture the complexities of war.
The fundamental objective of UCS deployment is to enhance the likelihood of victory in war, a culmination of successive battles rather than a single engagement.
Accordingly, this study goes beyond the limitations of single-battle simulations by presenting a comprehensive war modelling approach that provides significant implications for the strategic planning of force enhancement.
Research Design
This study aims to identify the optimal ratio between human combatants and UCS through war simulation. As both the ROK and the DPRK begin to integrate UCS into their respective armed forces, it becomes increasingly important to assess the potential impact of UCS on battlefield effectiveness. However, deriving an optimal force composition based on the outcomes of a war that has yet to occur is inherently constrained by the absence of empirical data. In such cases, where real-world observations are unavailable, simulation-based approaches offer one of the most effective means of forecasting future scenarios and generating actionable insights.
This study applies an agent-based model (ABM), initially developed in the field of ecology, to a simulation of warfare. As a key dynamic modelling framework in ecological research, ABMs have played a crucial role in analysing interspecies interactions and fluctuations in population dynamics within an environment. Among the various ABM frameworks, this study adopts a model rooted in the predator-prey dynamic, which has been widely used to capture the reciprocal interactions between species within an ecosystem.[7] The fundamental structure of the predator-prey model is particularly relevant for war simulation, as it provides a mechanism for assessing a system’s balance and overall state based on the population dynamics of two interacting entities. In this framework, an increase in prey leads to an increase in predators, while a rise in predator numbers ultimately results in a decline in the prey population.[8] However, conventional predator-prey relationships alone are insufficient for capturing the complexities of war dynamics. To better approximate military conflicts, this study moves beyond a simple unidirectional interaction. It introduces a more sophisticated ecological space wherein both entities engage in mutual combat rather than a one-sided predatory relationship.
The fundamental structure of the predator-prey model is particularly relevant for war simulation, as it provides a mechanism for assessing a system’s balance and overall state based on the population dynamics of two interacting entities.
In addition to predator-prey dynamics, models of symbiotic relationships from ecological research offer valuable insights for this study. Unlike the antagonistic nature of predator-prey interactions, symbiosis describes cooperative relationships between two or more entities within an ecosystem. These relationships can be classified into symmetric and asymmetric forms, with prior research exploring how different types of symbiosis influence ecological stability and environmental adaptation.[9] The concept of symbiosis is particularly relevant to this study in the context of UCS and the personnel responsible for its maintenance and support. The introduction of UCS necessitates the presence of human maintenance crews, and this relationship aligns more closely with an asymmetric symbiotic interaction, where one entity depends more heavily on the other.
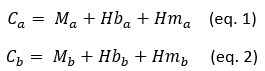
For war simulation, this study models a constrained battlespace in which two opposing groups operate. Each group consists of three distinct types of agents: Machine (M), representing UCS; Human Combatant (Hb); and Human Maintenance (Hm), responsible for the upkeep and repair of the machines. The aggregate number of these agents determines the overall capacity (C) of each group. The capabilities of each group can be mathematically represented using the following equations. Equations 1 and 2 formally express the capacity and operational potential of Group A and Group B, respectively.
Within each group, agents engage in cooperative symbiotic interactions, while hostile, predator-prey-like engagements characterise intergroup dynamics. Below is a visual representation of these cooperative intra-group interactions and antagonistic inter-group interactions.

Interaction among Agents; Source: Author.
The capabilities of individual agents within each group vary significantly within the modelled ecological space. At the top of the hierarchy, M units possess the ability to defeat all enemy entities without restriction. Hb units, positioned at an intermediate level, can attack all enemy agents except for opposing M units. In contrast, Hm units, which occupy the lowest tier in the group structure, do not participate in direct combat but are responsible for supporting and repairing allied M units. As per the picture above, bidirectional solid arrows indicate mutual combat interactions, unidirectional dashed arrows represent one-sided attacks, and unidirectional solid arrows denote asymmetric symbiotic relationships.
The agents within each group interact sequentially during combat engagements on the battlefield. These interactions result in destruction, damage, casualties, and injuries. Additionally, damaged M units can be repaired and redeployed in subsequent engagements, while wounded Hb and Hm agents may recover and return to combat in later stages. Throughout sustained engagements, the number of active agents fluctuates over time. The rate of change in the population of each agent type as a function of time can be expressed through the following differential equations.

Equation 3 represents the rate of change in the number of Ma units over time. The M units function as the apex predators within the battle space. Consequently, the decline in Ma occurs exclusively through engagements between Ma and Mb (Ma·Mb), where α represents the rate at which Ma units are destroyed or disabled during combat. Given that Hbb and Hmb lack the capability to attack Ma, no direct interaction occurs between these agents and Ma, and their presence does not influence Ma’s attrition. The final term in Equation 3 accounts for the rate at which Ma units are repaired and redeployed for subsequent engagements. A critical aspect of this dynamic is the asymmetric symbiotic relationship between Ma and Hma. As depicted in Figure 1, Ma units can only be reintroduced into battle if they receive support from Hma. Due to this dependence, the maximum number of operational Ma units is not determined by Ma’s intrinsic carrying capacity but rather by the availability of Hma. Fundamentally, the reintroduction of Ma is governed by its existing numbers, with β representing the redeployment rate shaped by the maintenance environment. Additionally, as indicated in the final term of the second component, Ma’s growth limit is ultimately constrained by Hma’s carrying capacity, which is itself capped at its initial value, K1a.

Equation 4 describes the evolution of Hba over time. Positioned as both a mid-tier predator and prey within the ecological system, Hb units operate under dual pressures. The first term in Equation 4 accounts for Hba’s attrition due to attacks by Mb, where γ denotes the lethality or wounding efficiency of Mb against Hba. The second term, Hba·Hbb, represents direct engagements between opposing Hb units, with ε indicating the proportion of Hba casualties or injuries resulting from these confrontations. The third term models the redeployment of Hba following combat. In principle, the number of Hb units reintroduced into battle is proportional to their existing numbers: larger pools of Hba lead to greater redeployment, while smaller numbers result in diminished reintroduction. The parameter ζ captures the redeployment rate, which is influenced by medical and recovery conditions. The final component within the parentheses incorporates the carrying capacity constraint, K2a. Without this limitation, Hba could grow indefinitely. By incorporating K2a, the model imposes an upper boundary on Hba’s numbers, assuming that this carrying capacity is determined by Hba’s initial value.
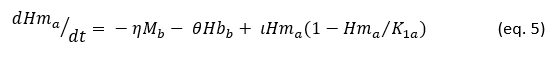
Equation 5 characterises the temporal variation in Hma. As Figure 1 suggests, Hm units occupy the lowest tier in the ecological hierarchy, functioning purely as prey with no offensive capability. As such, Hma and Hmb do not engage in direct combat, and Hma’s attrition is solely determined by predation from M and Hb units. The parameters η and θ represent the kill efficiency of Mb and Hbb, respectively, against Hma. Similar to Hba, the growth limit of Hma is limited by the carrying capacity K1. While Hma’s redeployment is primarily dictated by its initial numbers, an additional constraint is applied to prevent uncontrolled growth. The final term in Equation 5 introduces this limitation, where ι represents the redeployment rate, influenced by the medical and recovery environment. The carrying capacity K1a is assumed to be set by the initial value of Hm.
It is necessary to establish a set of simplified war simulation rules to extract meaningful insights from the simulated battlefield outcomes.
- Isolated Battlespace – The conflict environment is assumed to be completely sealed off from external influences. No third-party intervention is possible, and neither new agent types nor additional groups can emerge within the simulation;
- Fixed Initial Force Levels – The number of agents in each group cannot exceed its initial configuration. As previously defined, carrying capacity K constrains growth, preventing mobilisation surges or expanded weapons production. Thus, the maximum number of each agent type remains fixed at its initial value;
- Continuous Sequential Engagements – Combat occurs in a structured and periodic manner. While real-world conflicts may exhibit lulls, ceasefires, or strategic stalemates, the simulated environment assumes that engagements occur continuously without interruption; and
- Total Annihilation as a Termination Condition – A group is considered defeated once its agent population reaches zero. In actual warfare, conflicts may end due to shifts in power dynamics or negotiated settlements. However, in this model, hostilities persist until one group is entirely eliminated, at which point the war is deemed concluded.
Simulation Results
Before conducting the simulation, it is essential to define the parameters that govern the model, as represented by the Greek letters in Equations 3, 4, and 5. Since the empirical validation of these parameters is inherently challenging, their absolute values hold limited independent significance. Instead, the primary objective is to ensure that the assigned values maintain logical consistency, thereby allowing the simulation to produce analytically sound outcomes. The table below presents the definitions and assigned values of each parameter.
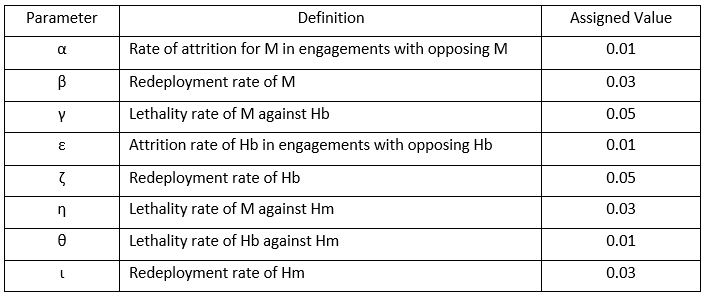
Definitions and Assigned Values of War Simulation Parameters; Source: Author.
The parameters α and ε, appearing in Equations 3 and 4, represent the depletion rates of M and Hb, respectively, in direct engagements between entities of the same category. That is, they define the rate at which forces are lost when fighting against adversaries of the same type. Notably, the attrition rates in M-to-M and Hb-to-Hb engagements are set to be identical. By contrast, the parameters β, ζ, and ι, appearing in Equations 3, 4, and 5, quantify the rate at which each category of unit is replenished following combat losses. As explicitly structured in the model, the number of reintroduced agents cannot exceed the carrying capacity, ensuring that the replenishment process remains constrained. Among the three agent types, Hb exhibits the highest redeployment rate, while M and Hm share a lower, but identical, rate of reinforcement. The parameters γ and η, featured in Equations 4 and 5, determine the effectiveness of M when killing Hb and Hm, respectively. The simulation assumes that M is more lethal against Hb than against Hm, leading to γ being assigned a value higher than that of η. Lastly, the coefficient θ in Equation 5 governs the effectiveness of Hb in eliminating Hm. The simulation presumes that Hb is less effective against Hm than M, resulting in θ being set at a relatively lower level. Building on the established parameters, the study conducts a series of combat simulations under four distinct scenarios, each designed to analyse how variations in force composition influence conflict dynamics.
Scenario 1 Result: Current State of ROK and DPRK
Scenario 1 most closely mirrors the current strategic balance between the ROK and the DPRK. Assuming a comparable level of UCS adoption between the two armies, the DPRK is modelled as possessing a significantly larger number of human combatants than the ROK. Accordingly, in the initial setting of the war simulation, Army A—representing the ROK—was composed of 50 Ma units, 50 Hba units, and 30 Hma units, while Army B—representing the DPRK—consisted of 50 Mb units, 100 Hbb units, and 30 Hmb units.
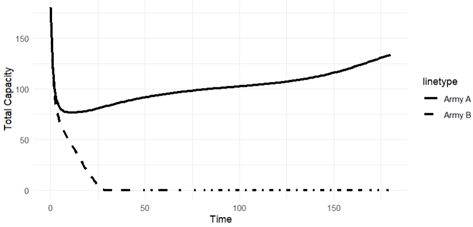
Scenario 1 Result; Source: Author.
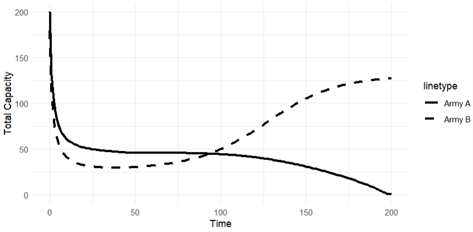
The figure above illustrates the results of the war simulation. In this scenario, Army A and Army B each contain 50 M units and 30 Hb units, maintaining numerical parity in these categories. However, differences in the number of Hb units (Hba: 50, Hbb: 100) create distinct conflict dynamics. The total capacity trajectory of Army B declines rapidly in the early stages of the conflict, experiences a brief recovery, and then begins to decrease again after approximately the 75th battle. Eventually, Army B’s overall capacity reaches zero around the 175th engagement. In contrast, Army A’s total capacity drops sharply at the outset, increases after the 50th battle, and stabilises at an equilibrium point after the 130th engagement. Although Army B started the war with a greater total capacity, it ultimately suffered defeat. This outcome is unexpected and requires further examination to determine the underlying causes. To understand the mechanisms driving this result, it is necessary to analyse how the composition of each army changes over time, as shown below.
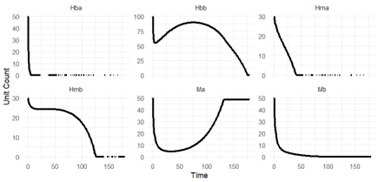
Unit Count for Scenario 1; Source: Author.
The figure above presents the trajectory of each agent type in Army A and Army B during Scenario 1. The data reveal that the unexpected outcome stems primarily from the trends observed in Ma and Hbb units. The numbers of Mb, Hba, and Hma decrease rapidly, while Hbb follows a different pattern. Initially, Hbb units decline, then briefly increase before resuming their downward trend. The number of Ma units also drops sharply in the early battles, but after the 50th engagement, their count begins to rise and eventually stabilises around the 130th battle. These patterns suggest that having a numerical advantage in human combatants does not necessarily guarantee victory. In designing the simulation model, we set carrying capacities for both Hb and Hm units. Carrying capacity not only defines the growth limits of the two agent types but also represents the maintenance costs associated with sustaining their numbers. As a result, a large number of Hb units imposes relatively higher costs, which, within the limits of carrying capacity, adversely affect the outcome of the war. Also, under these conditions, conflicts tend to become prolonged, delaying their resolution rather than leading to a decisive outcome in the early stages of warfare.
Scenario 2 Result: Strengthening UCS by ROK
The Scenario 2 models a confrontation between a military force dominated by M units and an opposing army primarily composed of Hb units, representing a case in which the ROK significantly enhances its UCS capabilities. This simulation aims to evaluate the relative combat effectiveness of UCS compared to traditional human-based warfare.

Scenario 2 Result; Source: Author.
The figure above illustrates the results of Scenario 2, which examines the dynamics of a conflict between Army A(ROK), characterised by a higher number of M units, and Army B(DPRK), which possesses a greater number of Hb agents. Army A is composed of 100 Ma units, 50 Hba units, and 30 Hma units. In contrast, Army B consists of 50 Mb units, 100 Hbb units, and 30 Hmb units. Despite the differences in composition, both armies maintain an identical total force size of 180 agents. In the figure, the solid line represents the trajectory of Army A’s total capacity over time, while the dashed line denotes the corresponding trajectory for Army B. As depicted in the graph, Army A experiences a sharp initial decline in total capacity during the early stages of the conflict. However, following approximately the 20th engagement, its capacity gradually recovers. In contrast, Army B’s total capacity continues to decline steadily, ultimately converging to zero after the 25th engagement. The simulation results demonstrate that Army A, with its M-heavy composition, decisively outperforms Army B, which relies primarily on Hbb units. The rapid attrition of Army B highlights the strategic advantage of an M-dominant force structure in sustained combat scenarios. These simulation results suggest that, under current conditions, a significant enhancement of the ROK’s UCS capacity could enable a swift victory over the DPRK. Compared to Scenario 1, Army B—representing the DPRK—experiences a much more rapid depletion of its total capacity in Scenario 2.
Scenario 3 Result: Strengthening Human Combatant and Maintenance Capacity by the ROK
Scenario 3 Result; Source: Author.
Scenario 3 examines how variations in the number of Hb and Hm units influence conflict dynamics, with both armies initially possessing 50 M units and 100 Hb units. However, Army A allocates 50 Hm units, while Army B maintains its baseline level of 30 Hm units. This scenario is designed to simulate a case in which the ROK (represented by Army A) enhances its human-related capacities—namely Hb and Hm—without reinforcing its UCS units. Both armies experience a sharp decline in total capacity during the initial phase of the conflict, followed by a gradual deceleration in the rate of decline. Around the 75th battle, the trajectories of the two armies begin to diverge. While Army A’s total capacity continues to decline slowly until the end of the war, Army B’s capacity begins to recover, eventually surpassing that of Army A around the 100th battle. Despite Army A starting the conflict with a higher total capacity, sustained attrition over time leads to Army B ultimately securing victory. This outcome is notably counterintuitive: although the ROK invested in strengthening its human resources, it still suffered defeat in the simulated conflict.

Unit Count for Scenario 3; Source: Author.
The figure above presents the trajectory of unit composition for Army A and Army B in Scenario 3, illustrating how the number of different agents evolved over time. Both armies exhibit a rapid and simultaneous decline in the number of M units. However, the dynamics of Hba and Hbb differ significantly. While both decline sharply in the early stages, Hbb later recovers, whereas Hba fails to rebound. A similar divergence is observed in the trajectories of Hma and Hmb. Although both gradually decline in the early stages of the war, Hma experiences an accelerated decrease during the latter stages, while Hmb begins to recover gradually during the early phase. These patterns are fundamentally driven by the carrying capacity constraints established during the simulation design phase. Notably, as seen in the results of Scenario 1—where Army B had a higher total capacity but still lost the war—Scenario 3 also reveals that Army A, despite having a larger initial capacity, is ultimately defeated. This outcome is primarily attributed to the higher maintenance costs associated with human-related capacities. Furthermore, the duration of the conflict in Scenario 3 is considerably longer than in the previous scenarios.
Scenario 4 Result: Strengthening UCS and Human Combatant Capacity by ROK

Scenario 4 Result; Source: Author.
This figure presents the results of Scenario 4. In this scenario, the number of Hb and Hm units is identical for both armies, allowing for an analysis of how differences in the quantity of M units influence the course of the conflict. This scenario illustrates the outcome when the Republic of Korea (represented by Army A) strengthens both its UCS and human combatant forces. Both Army A and Army B possess 100 Hb units and 30 Hm units at the onset of the simulation. However, Army A begins with 100 M units, whereas Army B starts with only 50 M units. As depicted in the figure, the army with a greater number of M units, Army A, secures victory in a remarkably short period. The trajectory of Army B’s total capacity, represented by the dashed line, converges to zero after approximately the 15th battle. Compared to the prior simulations, this scenario results in the most rapid conclusion of the war.
Conclusion
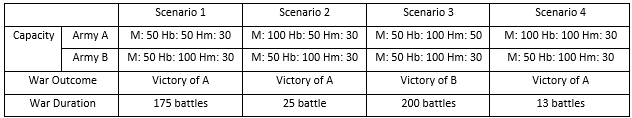
The following table presents the simulation results. While the initial force structure of Army B remains constant, the outcomes and durations of the war are compared across scenarios in which Army A strengthens its UCS units, its human-related forces, or both.
Simulation Results; Source: Author.
The results of the war simulation carry important strategic implications for countries like the ROK, which face chronic personnel shortages. First, in terms of war outcomes, enhancing human-related capabilities alone does not guarantee victory. As shown in Scenarios 1 and 3, the side with greater total capacity still suffers defeat. In both cases, the losing side possesses stronger human-based forces—either Hb or Hm. This suggests that despite their larger total capacity, the high costs associated with maintaining human forces may contribute to failure in combat. In the simulation design, the carrying capacity linked to human components reflects the sustaining cost of personnel. Therefore, when expanding human-based capabilities, states must carefully consider the burden of these maintenance costs.
Second, the results provide insight into the ongoing debate: should UCS be integrated with human combatants, or should it fully replace them? For countries like the ROK, which are grappling with manpower shortages, the introduction of UCS is often seen as a means to fill operational gaps created by declining troop numbers. However, a comparison of Scenarios 2 and 4, both of which emphasise UCS enhancement, reveals a critical point: augmenting human combat power alongside UCS deployment leads to significantly shorter war durations. Although both scenarios feature strengthened UCS units, the war in Scenario 4—where human combatants were also reinforced—lasted only about half as long as in Scenario 2. This indicates that rather than substituting humans with UCS, a more effective strategy is to integrate and enhance both force types simultaneously. A coordinated deployment of human and UCS assets results in faster and more decisive victories.
This research carries profound implications for states grappling with conscription shortages due to dramatic population decline. The insights derived from this study illuminate the complex interplay between UCS, human soldiers, and maintenance personnel in shaping contemporary warfare dynamics. By incorporating these variables, the simulations in this study provide a more comprehensive understanding of the strategic consequences of UCS deployment. These findings are particularly relevant for military planners and policymakers as they underscore the importance of a balanced approach to force composition in future military strategies. Moreover, the study emphasises the need for further research into the reliability and maintenance challenges associated with UCS, as well as the broader strategic implications of integrating UCS into military operations. Through sensitivity analysis, this study also identifies scenarios in which an increase in UCS deployment does not result in a significant change in either war outcomes or duration. This reveals the potential limitations of UCS efficacy when deployed in isolation. Additionally, by diversifying the simulation design that governs the unidirectional symbiotic relationship between Hm and M, future simulations may yield new insights into how shifts in inter-agent dependencies affect both the trajectory and duration of conflict.
The principal limitation of this study lies in the need to enhance the reliability of the parameters governing each agent’s lethality and redeployment rates. Despite this limitation, this study holds substantial potential. Future research should further analyse the relationship between variations in model parameters and changes in war outcomes to deepen our understanding of how the composition of human and machine forces influences both combat effectiveness and the probability of war victory.
Kieun Sung; Conflict Studies/Methodology; “Unpacking Conflict Process on the Korean Peninsula with Political and Seasonal Distribution.” Pacific Focus 39.2 (2024): 303-331; Political Science. Insoo Kim; Civil-Military Relations/Security Studies; “Differences in Cultural Dimensions Between South Korean Officers and Conscripts: A Topic Modelling Approach.” Armed Forces & Society (2024); Sociology. Yeeun Hwang; International Relations. The views contained in this article are the author’s alone and do not represent the views of Korea Military Academy.
[1] Statistics Korea, Population Statistics, 2024, accessed February 26, 2025, https://kostat.go.kr/anse/.
[2] Ministry of National Defense, 2022 Defense White Paper (Republic of Korea: Ministry of National Defense, 2022).
[3] K. Telli et al., “A Comprehensive Review of Recent Research Trends on Unmanned Aerial Vehicles (UAVs),” Systems, no. 11-8 (2023): 400; Paul Scharre, Army of None: Autonomous Weapons and the Future of War (New York: W. W. Norton & Company, 2018).
[4] Hongseob Eom, “A Study on the Combat Effectiveness of Dronebot Combat System Using Lanchester’s Law,” KRIS (Korea Research Institute for Strategy) Strategy Research 28, no. 1 (2021): 165–90; Ojeong Kwon, Yihwa Song, Jingu Kim, and Namsuk Cho, “A Study on Combat Effectiveness of Personal Combat Drone Using Analytic Hierarchy Process Method,” Journal of the Military Operations Research Society of Korea 47, no. 2 (2021): 36–49.
[5] J. Pekarev, “Attitudes of Military Personnel Towards Unmanned Ground Vehicles (UGV): A Study of In-Depth Interview,” Discover Artificial Intelligence, no. 3-1 (2023): 24; X. Zhou et al., “Research on the Development of Unmanned Systems for Joint Operations,” in: China Conference on Command and Control (Singapore: Springer Nature Singapore, 2023), 581–92.
[6] Alastair Smith, “Fighting Battles, Winning Wars,” Journal of Conflict Resolution, no. 42-3 (1998): 301–20.
[7] Gary An, Qing Mi, Joy Dutta-Moscato, and Yoram Vodovotz, “Agent-Based Models in Translational Systems Biology,” Wiley Interdisciplinary Reviews: Systems Biology and Medicine, no. 1-2 (2009): 159–71; J. D. Murray, Mathematical Biology: I. An Introduction (New York: Springer, 2002); J. D. Parrish and S. B. Salia, “Inter-Specific Competition, Predation and Species Diversity,” Journal of Theoretical Biology 27, no. 2 (1970): 207–220; R. P. Pech and G. M. Hood, “Foxes, Rabbits, Alternative Prey and Rabbit Calicivirus Disease: Consequences of a New Biological Control Agent for an Outbreaking Species in Australia,” Journal of Applied Ecology, no. 3 (1998): 434–53.
[8] Mark S. Boyce, “Modeling Predator–Prey Dynamics,” Research Techniques in Animal Ecology, no. 253 (2000): 253–87; Peter Chesson, “Predator-Prey Theory and Variability,” Annual Review of Ecology and Systematics, no. 9 (1978): 323–47.
[9] V. I. Yukalov, E. P. Yukalova, and D. Sornette, “Modeling Symbiosis by Interactions Through Species Carrying Capacities,” Physica D: Nonlinear Phenomen, no. 241-15 (2012): 1270–89; V. I. Yukalov, E. P. Yukalova, and D. Sornette, “New Approach to Modeling Symbiosis in Biological and Social Systems,” International Journal of Bifurcation and Chaos no. 24- 9 (2014): 1450117. (Yukalov et al., 2012; Yukalov et al., 2014).