Abstract: The evolution of battlefield surveillance, from traditional elevated vantage points to advanced satellite remote sensing, has transformed geospatial data into actionable insights. The research focuses on creating a Digital Twin of a battlefield using a range of data sources. A methodology for assessing terrain features, such as visibility, slope, and soil moisture, is developed, along with a model for vegetation cover using Sentinel-2 data. Imitation Learning is employed to simulate military strategies based on human decision-making processes, generating synthetic data that represent real-world conditions.
Problem statement: How to combine Digital Twins and Imitation Learning to replicate human decision-making and generate synthetic data that reflects real-world dynamics in military settings?
So what?: A combination of models and products that continuously update a digital replica of battlefield conditions must be developed. Based on its output, “what-if” scenarios and real-time situations should be translated into simulations, allowing conflict scenarios to unfold according to human strategies. The military can then utilise this synthetic data for both human and machine training and decision-making assessments.
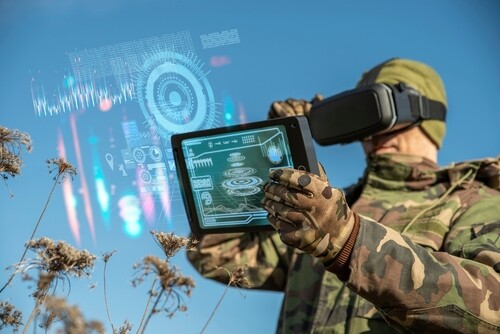
Source: shutterstock.com/TSViPhoto
Battlefield Observation
Battlefield observation has been a critical aspect of military strategy since ancient times, providing vital information for decision-making in military endeavours. A common approach was to gather intelligence by observing the battlefield from elevated positions, such as cliffs or other high vantage points, allowing for a comprehensive view of the area of interest. Fast forward to the present day, and battlefield observation remains just as crucial for gaining insights. Still, the methods and tools have evolved to provide quicker responses and enhanced predictive capabilities. In recent conflicts, Satellite Remote Sensing methods have become integral for surveillance and reconnaissance, transforming terrain data into actionable insights for military decision-making.
Satellite Remote Sensing methods have become integral for surveillance and reconnaissance, transforming terrain data into actionable insights for military decision-making.
The Digital Twin Concept
At the same time, the concept of the Digital Twin has advanced significantly. A Digital Twin is a digital replica of a physical entity, where events in the real world are mirrored in the virtual model. While the concept of a Digital Twin is not new, its application in battlefield observation has yet to be fully explored, particularly from an academic perspective.[1] This emerging field could hold significant potential for revolutionising how military operations monitor and analyse battlefield conditions.
Imitation Learning
On the other hand, imitation learning represents a distinct field within artificial intelligence, primarily focused on mimicking human behaviour. Initially popularised in the realm of entertainment games, such as chess, to create AI opponents, imitation learning has been largely overlooked in other scientific disciplines. However, the battlefield is inherently dynamic, with strategies often shaped by human-level decision-making. By capturing various human strategies in different battlefield conditions, imitation learning can be leveraged to create tailored synthetic data through battlefield simulations.[2]
The intersection of Digital Twin technology and imitation learning is an unexplored frontier. This combination could generate dynamic virtual representations of real-world conditions for a given area of interest, simulating different unit positions and conflict scenarios. Doing so would offer a powerful tool for training, analysis, and strategic decision-making in military settings. In this study, the data sources, methods, and tools for creating such a Digital Twin will be assessed along with the associated challenges.
Data Collection
The building blocks of the proposed Digital Twin are the data. The first step in data collection involves defining the data sources necessary to create the Digital Twin. This is a complex task, as there are numerous sources of data, each associated with specific sensors. Land cover data are efficiently captured with optical and multispectral sensors, urban and soil moisture data are captured with a Synthetic Aperture Radar (SAR) sensor, while road networks are provided on OpenStreetMap (OSM). The challenge is also compounded by data being collected at different time intervals, and constant updates for some data points may not be required. For instance, a mountain slope undergoes minimal change on a day-to-day basis; however, significant differences become more evident over extended periods, demonstrating the importance of selecting appropriate intervals for data collection and analysis.
Land cover data are efficiently captured with optical and multispectral sensors, urban and soil moisture data are captured with a Synthetic Aperture Radar sensor, while road networks are provided on OpenStreetMap.
To maximise efficiency and resourcefulness in data gathering, it is crucial to define the temporality of the data. Temporal data refers to data that requires varying frequencies of updates based on its relevance over time. High-temporal data demands frequent updates, while lower-temporal data may not need constant monitoring as significant changes become apparent over longer periods. For creating a battlefield Digital Twin, specific datasets—such as the Digital Elevation Model (DEM)—are considered more temporally significant. These datasets remain relatively stable over time, making them crucial for accurately representing the terrain in the Digital Twin model.[3]
One of the most widely used digital elevation models is the Copernicus Global 30m (CopDEM), which is frequently employed in scientific research. The Copernicus Global 30m is publicly available and performs better in urban areas and vegetation-covered landscapes than the ALOS model. However, its performance on steep slopes is not optimal. CopDEM generally exhibits more consistent global accuracy than the CDEM. While NASADEM and ASTER datasets show the largest positive discrepancies, Copernicus DEM displays the most significant negative discrepancy, with values lower than the true measurements. Other models, such as GLO-30 DEM, ALOS AW3D30 DSM, CDEM, ICESat, and AW3D, also contribute to the comparison of elevation data accuracy.[4], [5], [6]
The Digital Elevation Model (DEM) offers valuable insights when integrated into a Digital Twin within a military context. It enables the creation of maps depicting the visibility of friendly forces in relation to enemy positions and vice versa. Additionally, the DEM can be used to extract slope data, which is crucial for assessing vehicle mobility in specific areas. By combining slope information with the vehicle’s characteristics, it becomes possible to evaluate terrain permeability and optimise tactical planning.[7]
By combining slope information with the vehicle’s characteristics, it becomes possible to evaluate terrain permeability and optimise tactical planning.
Challenger arise from the simplicity and limitations of traditional visibility analysis, and advanced techniques have been proposed that utilise 3D graphic software, addressing the limitations of traditional Geographic Information Systems (GIS)based viewshed analysis. Although GIS advancements have introduced new models that utilise 3D graphic software, providing better accuracy and efficiency,[8], [9] Digital Surface Models (DSMs) provide a better alternative to DEMs as they measure the elevation of each object, though with a costly acquisition.[10] One-Shot depth estimation, a method for calculating depth from single optical images, is experiencing growth, but only for high-resolution satellite imagery.[11] In the case of the Digital Twin’s initial development phase, the viewshed assessed solely by the DEM is a good starting point.
The temporality of data collection, particularly regarding the existence and development of buildings, has been a subject of considerable reflection. One significant challenge in analysing urban landscapes is the time it takes to construct buildings, a process that spans varying durations and can differ substantially from one geographic location to another. Furthermore, buildings do not appear with high frequency in any given area, making their monitoring a more intermittent task. Suggesting a frequency of data acquisition for urban footprint estimation poses a challenge and must be considered by the user, as frequent gathering of urban landscape products can cause storage capacity limitations, while infrequent observations may miss early-stage or completed construction.
Several data sources can be utilised to assess the presence and characteristics of buildings in urban environments. Among the most accessible and widely used tools is OpenStreetMap (OSM), a collaboratively maintained mapping platform that offers publicly available geographic data. OSM relies heavily on its open community of contributors for the accuracy and completeness of the data, which, in principle, allows for continuous updates and coverage.[12] In military planning, OSM provides an urban footprint with higher resolution, outlining the building perimeter in the context of urban warfare planning.[13] However, one must approach this data with caution, as certain building footprints may be missing or outdated, particularly in rapidly developing or underrepresented regions. While OSM is an invaluable resource, its reliance on voluntary contributions and local knowledge introduces the possibility of gaps or inconsistencies in mapping urban environments.
In military planning, OSM provides an urban footprint with higher resolution, outlining the building perimeter in the context of urban warfare planning.
In contrast, the use of Synthetic Aperture Radar (SAR) imagery provides a different, more technologically advanced method for assessing urban landscapes. The Copernicus Sentinel-1 Mission, in particular, has revolutionised the way urban areas are monitored. By utilising SAR data, which can capture detailed information about the Earth’s surface regardless of weather conditions or time of day, it enables frequent and reliable monitoring of buildings and other structural features. The revisit frequency of the Sentinel-1 Mission, ranging from two to six days,[14] is particularly advantageous for tracking changes in urban environments with a relatively high temporal resolution. This frequent data acquisition allows for more precise monitoring of new developments, alterations to existing buildings, and other dynamic changes in urban areas.[15], [16]
Road networks are critical when assessing human presence through remote sensing imagery, much like veins in a biological system. While buildings are often seen as vital in such assessments, road networks play an equally indispensable role. They are essential for facilitating the movement of land vehicles and ensuring the mobility and deployment of infantry, equipment, and resources. In the context of a battlefield Digital Twin, road networks serve as a fundamental infrastructure element, supporting both strategic manoeuvring and logistical operations. Their importance goes beyond transportation, as they enable operational efficiency and accessibility, shaping the dynamics of both military and civilian activities. The Sentinel Mission products provide lower-resolution images that cannot capture road networks, except for some major roads. Given the challenges of extracting road networks from satellite resolutions like those of the Sentinel Missions, road footprints were sourced from OpenStreetMap.
In the context of Synthetic Aperture Radar (SAR) imagery, Sentinel-1 can effectively monitor and assess soil moisture levels, which are crucial for understanding terrain conditions that impact military operations. Soil moisture plays a significant role in military activities, as it can hinder the movement of personnel and vehicles and contribute to the failure of various types of equipment. However, directly assessing soil moisture using remote sensing techniques can be challenging due to the complex interactions between radar signals and soil properties.[17], [18]
Soil moisture plays a significant role in military activities, as it can hinder the movement of personnel and vehicles and contribute to the failure of various types of equipment.
Sentinel-2 data is crucial in land cover estimation, particularly in gathering remote sensing indices related to vegetation.[19], [20] Vegetation cover is an essential factor in military decision-making, as it directly impacts the movement of units, ground permeability, and the ability to conceal movements or assets. To derive the necessary information to represent vegetation cover in the Digital Twin, the Tree Density High-Resolution Layer, Small Woody Features High-Resolution Layer, and Grassland High-Resolution Layer were obtained from the Copernicus Open Access Hub. These layers were used as ground truth to correlate with remote sensing indices, ensuring that the Digital Twin remains continuously updated with current vegetation information. These layers provide valuable insights into vegetation characteristics,[21], [22], [23] which can influence both tactical and strategic military operations. Understanding these variables is vital for assessing terrain and improving operational effectiveness in complex environments.
Data Cleaning and Processing
The data from the aforementioned sources must be processed to transform it into relevant information. The Copernicus Global Elevation Model was utilised as the base for the Digital Twin and integrated into ArcGIS Pro. By processing it as a raster product, the slope of the terrain could be calculated, providing valuable insights into the terrain’s morphology. To further enhance the analysis, the viewshed of military units was determined through Visibility Analysis, which helps assess line-of-sight and potential cover. Additionally, road data was incorporated into ArcGIS Pro. While each road type has distinct attributes that could affect mobility, this study chose to treat all roads equally without considering the varying weight each type might have on movement efficiency.
Monitoring population displacement and urban expansion is critical as urban areas significantly impact military operations. Additionally, the timely detection of insurgent base construction is essential for strategic planning. Sentinel-1 data were obtained from the Copernicus Open Access Hub to support this. The Sentinel-1 product used for this analysis featured dual polarisation, specifically HV and VV polarisations. The VV polarisation is particularly effective in urban footprint estimation, as it efficiently captures backscatter from flat surfaces, making it suitable for identifying urban areas.
The image is first imported into ESA’s SNAP software for urban footprint estimation to begin the preprocessing procedure. Radiometric calibration is applied to the VV band to prevent any information leakage from the VH band into the VV band, ensuring the accuracy of the analysis. SAR products typically contain significant noise, known as speckle, which arises due to the interaction of electromagnetic pulses with the environment. The Refined Lee filter algorithm is employed and applied to the radiometrically calibrated VV band to mitigate this speckle noise. Additionally, terrain correction is performed to minimise the influence of terrain variations on the SAR values, improving the overall data quality.
Radiometric calibration is applied to the VV band to prevent any information leakage from the VH band into the VV band, ensuring the accuracy of the analysis.
Subsequently, the SAR image undergoes further processing using the Speckle Divergence Algorithm available in ESA’s SNAP software, allowing for the extraction of the urban mask. This workflow can be applied in a pipeline at user-specified time intervals, enabling continuous updates to the mask and the detection of changes, whether in the form of urban growth or population displacement.
The contribution of Sentinel-1 to soil moisture estimation can be attributed to the backscatter effect, where the interaction between the soil and the electromagnetic pulse varies based on the soil moisture content. Different soil moisture levels absorb the pulse differently, providing valuable data. However, a reference dataset must first be created to accurately assess the soil’s moisture percentage. This was done using the OpenEO API to generate a raster image of the Area of Interest (AOI), where each pixel represents the minimum backscatter value recorded over the course of one year. This approach ensures that each pixel reflects the driest condition of the soil within that year. By comparing this reference product with the user’s downloaded Sentinel-1 GRD data from a specific revisit, it is possible to assess the percentage of moisture the soil has undergone.
The use of Sentinel-2 products for land cover estimation presents a challenge when attempting to monitor over different time intervals. Vegetation and other land cover types exhibit varying spectral identities at different times, making it difficult to determine accurate reflection values for vegetation cover from a single image. The Copernicus vegetation products, as discussed earlier, are often regarded as ground truth. While they may not be entirely accurate, they represent one of the best estimates of open-source data available for use as ground truth. However, these products are not provided at frequent intervals; instead, they are typically released on a yearly basis or at longer intervals, which limits their applicability for monitoring changes over shorter periods.
A model was developed to address this limitation using the Copernicus Access Hub’s High-Resolution Layers as ground truth and Vegetation Indices as input data. As mentioned, vegetation and other entities have different spectral identities at various times, so collecting input data from different time points is crucial. The OpenEO API was utilised to gather mean values for the pixels within the Area of Interest over a two-year interval. This approach enables more representative spectral identities over time, accurately reflecting vegetation cover changes.
The mean value of each pixel within the Area of Interest was calculated for each vegetation index. Since many vegetation indices have different scales, normalisation was applied to bring them to a common scale, ensuring they can be effectively used as input data for the model. Rather than performing a random shuffle to separate training and test data, stratified sampling was used. This method splits the data based on its distribution by first converting the continuous predicted variable into categorical data, ensuring a more balanced representation in the training and test sets.
The mean value of each pixel within the Area of Interest was calculated for each vegetation index.
The XGBoost model was then employed for analysis, and evaluation metrics were calculated to assess its performance. This model can now be applied to any time interval the user wishes to assess vegetation cover in the Area of Interest, providing flexibility for monitoring and analysis over varying periods.
Due to the restrictions on military surveillance data and the licenses required for simulation software, simplified rules were applied to the units in the simulation. The first team of units prioritised approaching the target location by seeking concealment areas, while the second team focused on permeability capability. The Intersect tool in ArcGIS Pro was employed to determine the grid code for each unit’s position relative to the concealment and permeability layers, as well as to calculate the distance from the target at each step. The extracted data was then exported to Excel, where one-hot encoding was applied to the categorical variables. The continuous variable, distance, was normalised, and the encoded values were scaled to match the same range as the continuous variable for consistency. A random forest model was then used to mimic the player’s strategy to unseen data.
The Unity Engine was used to simulate the landscape and create a synthetic environment incorporating GIS data. A Unity simulation program, adapted from previous work, was employed to facilitate this process. The software reads landscape class data in raster format and, based on the class values, imports corresponding 3D graphics. These 3D graphics are derived from photogrammetric imagery, ensuring that the environment closely represents reality while also considering the hardware capabilities available for rendering the simulation.
Results and Challenges
To realistically replicate battlefield behaviour, the Digital Twin-based simulation must accurately represent terrain conditions. For this reason, models that rely on land cover data as ground truth should be assessed first. The XGBoost model, which predicts the High-Resolution Layer tree density, achieved an F1-score of 82%. However, it is important to note that the model was treated as a classification problem, as the continuous values of the dependent variable were subjected to one-hot encoding. Additionally, samples from different segments of the AOI need to be incorporated to enhance the model’s generalisability to a broader scene.
To realistically replicate battlefield behaviour, the Digital Twin-based simulation must accurately represent terrain conditions.
The model used to mimic the human strategy achieved an accuracy of 88% for the first strategy based on permeability and 76% for the cover suitability strategy. Both strategies were relatively straightforward, as they were based on hypothetical examples due to the unavailability of military data. However, the cover suitability strategy presents some complications. These complications arise because factors such as distance, current, and next-step suitability cover alone are not the sole predictors of the strategy. Further spatial correlation approaches should be considered to explain the strategy accurately, as the player evaluates the environment based on intersecting suitability classes and those farther away.
The simulation of the terrain exhibited realistic traits, as many objects were created using photogrammetry techniques. However, more commercial tools should be considered for military simulations—tools that also offer military behaviour and planning functionalities. These tools would enable the visualisation of variations in hypothetical ongoing conflicts based on near-real-time information from the Digital Twin or data derived from “what-if” scenarios.
The permeability analysis, cover suitability and soil moisture lack ground truth and were provided here as a baseline demonstration. Data regarding vehicle permeability is challenging to obtain, as conditions such as speed and the likelihood of getting stuck must be assessed, which are difficult to reproduce in vitro. Following physical models—many of which assume ideal conditions or adhere to specific military regulations (though the exact term is unclear)—is necessary to create more refined products for military applications. Additionally, the backscatter effect alone is insufficient; integrating Sentinel-1 data with auxiliary datasets, such as those from the European Soil Database and OpenWeatherMap can be a valuable add-on. By correlating SAR-based soil moisture estimates with these additional data sources, a more accurate and comprehensive understanding of soil behaviour can be achieved, leading to more informed decision-making and improved operational planning.
Confronting Challenges
A framework for integrating data from various sources has been provided. Along with the advantages of the models based on the Copernicus High-Resolution Layers as ground truth data and the use of Unity for the Digital Twin-based simulation, some challenges must be confronted. Real battlefield behaviour data must be gathered or synthetically created based on real-world engagement rules. Simulation software will serve as a valuable addition to the development of this research. Case studies should be conducted to assess whether training done through simulations from a Digital Twin is more effective, as well as to evaluate data generation for machine learning training and determine how closely the simulation reflects the real world.
Real battlefield behaviour data must be gathered or synthetically created based on real-world engagement rules.
Michail Kefalakis, Computer Science and Biomedical Informatics, Geospatial Sciences, PhD Candidate in the Hellenic Army Academy with research interests focusing on Remote Sensing, Digital Twins for Military Applications, Deep Learning, Computer Vision.
Nikolaos V. Karadimas, Associate Professor in the Department of Military Sciences at the Hellenic Army Academy, with research interests focusing on Military Applications, Databases, Big Data, Operational Resource Management, Geographic Information Systems, Simulation Algorithms and Modeling, as well as Decision Support Systems.
The views contained in this article are the authors’ alone.
[1] Diego M. Botín-Sanabria et al., “Digital Twin Technology Challenges and Applications: A Comprehensive Review,” Remote Sensing 14, no. 6 (2022): 1335, https://doi.org/10.3390/rs14061335.
[2] Kangyu Wu et al., “A Training Model of Wargaming Based on Imitation Learning and Deep Reinforcement Learning,” Chinese Intelligent Systems Conference, Springer Nature Link, (2022): 786–795, https://doi.org/10.1007/978-981-19-6203-5_78.
[3] “Evelpis Project,” Development of the Spatial Component for a Battlespace Digital Twin, Hellenic Army Academy, accessed March 08, 2025, https://geo.sse.gr/evelpis_project/.
[4] Sebastiano Trevisani et al., “Global Digital Elevation Models for Terrain Morphology Analysis in Mountain Environments: Insights on Copernicus GLO-30 and ALOS AW3D30 for a Large Alpine Area,” Environmental Earth Sciences 82, no. 9 (2023): 198, https://doi.org/10.1007/s12665-023-10882-7.
[5] Chukwuma J. Okolie et al., “Assessment of the Global Copernicus, NASADEM, ASTER, and AW3D Digital Elevation Models in Central and Southern Africa,” Geo-spatial Information Science 27, no. 4 (2024): 1362–90, https://doi.org/10.1080/10095020.2023.2296010.
[6] Shannon Franks and Rajagopalan Rengarajan, “Evaluation of Copernicus DEM and Comparison to the DEM Used for Landsat Collection-2 Processing,” Remote Sensing 15, no. 10 (2023): 2509, https://doi.org/10.3390/rs15102509.
[7] Hrvoje Heštera and Mladen Pahernik, “Physical-geographic factors of terrain trafficability of military vehicles according to Western World methodologies,” Hrvatski Geografski Glasnik/Croatian Geographical Bulletin 80(2), (2018): 5-31, https://doi.org/10.21861/HGG.2018.80.02.01.
[8] Rafał Wróżyński et al., “Reaching Beyond GIS for Comprehensive 3D Visibility Analysis,” Landscape and Urban Planning 247, (2024): 105074, https://doi.org/10.1016/j.landurbplan.2024.105074.
[9] Nicole C. Inglis et al., “From Viewsheds to Viewscapes: Trends in Landscape Visibility and Visual Quality Research,” Landscape and Urban Planning 224, (2022): 104424, https://doi.org/10.1016/j.landurbplan.2022.104424.
[10] Qianjiang Hu et al., “RangeLDM: Fast Realistic Lidar Point Cloud Generation,” ECCV 2024, Springer Nature Link, (2024): 115-135, https://doi.org/10.1007/978-3-031-72784-9_7.
[11] Jian Song et al., “SynRS3D: A synthetic dataset for global 3D semantic understanding from monocular remote sensing imagery,” arXiv preprint arXiv:2406.18151, (2024): https://doi.org/10.48550/arXiv.2406.18151.
[12] “About OpenStreetMap,” OpenStreetMap, accessed March 06, 2025, https://www.openstreetmap.org/about.
[13] Alessandro Sarretta et al., “OpenStreetMap as an input source for producing governmental datasets: The case of the Italian Military Geographic Institute,” The International Archives of the Photogrammetry, Remote Sensing and Spatial Information Sciences 48 (2023): 193-200, https://doi.org/10.5194/isprs-archives-XLVIII-4-W7-2023-193-2023.
[14] “Overview of Sentinel 1 Mission”, S 1 Mission, accessed, March 06, 2025, https://sentiwiki.copernicus.eu/web/s1-mission.
[15] Abhinav Verma et al., “Built-up area mapping using Sentinel-1 SAR data.” ISPRS Journal of Photogrammetry and Remote Sensing 203 (2023): 55-70, https://doi.org/10.1016/j.isprsjprs.2023.07.019.
[16] Nour Mahmoud et al., “A Proposed Methodology for Detecting the Urban Footprint in Egypt,” IOP Conference Series: Earth and Environmental Science 992, no. 1 (2022): IOP Publishing, doi:10.1088/1755-1315/992/1/012008.
[17] Narayanarao Bhogapurapu et al., “Field-Scale Soil Moisture Estimation Using Sentinel-1 GRD SAR Data,” Advances in Space Research 70, no. 12 (2022): 3845–58, https://doi.org/10.1016/j.asr.2022.03.019.
[18] A. M. Zeyliger et al., “Field F Test of the Surface Soil Moisture Mapping Using Sentinel-1 Radar Data,” Science of the Total Environment 807 (2022): 151121, https://doi.org/10.1016/j.scitotenv.2021.151121.
[19] Jian Xue and Baohua Su, “Significant Remote Sensing Vegetation Indices: A Review of Developments and Applications,” Journal of Sensors, no. 1 (2017): 1353691, https://doi.org/10.1155/2017/1353691.
[20] Lin Gao et al., “Remote Sensing Algorithms for Estimation of Fractional Vegetation Cover Using Pure Vegetation Index Values: A Review,” ISPRS Journal of Photogrammetry and Remote Sensing 159 (2020): 364–77, https://doi.org/10.1016/j.isprsjprs.2019.11.018.
[21] “High-Resolution Layer – Tree Cover Density,” Copernicus Land Monitoring Service, accessed March 06, 2025, https://land.copernicus.eu/en/products/high-resolution-layer-tree-cover-density.
[22] “High-Resolution Layer – Small Woody Features,” Copernicus Land Monitoring Service, accessed March 06, 2025, https://land.copernicus.eu/en/products/high-resolution-layer-small-woody-features.
[23] “High-Resolution Layer – Grassland,” Copernicus Land Monitoring Service, accessed March 06, 2025, https://land.copernicus.eu/en/products/high-resolution-layer-grassland.