
Abstract: Over a long period of time, India has been pushing to internationalise Indian Rupees. Similarly, China is pushing for an international acceptance of the Renminbi (RMB). In this competition, the RMB got an edge as the International Monetary Fund (IMF) included the RMB in the Special Drawing Rights (SDRs) basket. Over time, Beijing adopted policies which promoted international and cross-border trade. These policies helped the RMB to overshadow the INR in the race for internationalisation.
Problem statement: How to understand India’s existing trade relations and policies compared to the People’s Republic of China?
So what?: The Indian government and RBI should focus on formulating policies that would promote an increment in trade and investment with the nations which are part of the Bay of Bengal Initiative for Multi-Sectoral Technical and Economic Cooperation (BIMSTEC).

Source: shutterstock.com/Allexxandar
India’s Economic Growth
India’s Gross Domestic Product for Financial Year (FY) 2022-23 is projected to increase by 16.2 per cent compared to FY21-22,[1] this news came at a time when New Delhi’s imports for April-March of FY22-23 surpassed the previous year by margin of 132.12 billion U.S. dollar (USD).[2] Moreover, the inflow of Foreign Direct Investment (FDI) has increased over the years; for FY21-22, it was at 83.57 billion USD. This showcases how India’s economic growth is susceptible to the butterfly effect of U.S. monetary and economic policy. Indian economy faced the impact of the recent change in the monetary policy of the U.S. Federal Reserve. To tackle the rising inflation rate caused by the ongoing Russian invasion of Ukraine, after the first quarter of 2022, the Federal Reserve hiked the rate aggressively by more than five percentage points within 16 months.[3] Due to this, as of December 2022, foreign portfolio investors (FPIs) withdrew around 18.1 billion USD from the Indian stock market.[4] As a result, the value of the Indian currency (INR) depreciated further against USD, which increased the import cost. This impacts countries like India, which is largely dependent on imports. Under this circumstance, India must de-risk its economy from the dollar. One such method is to promote foreign trade in INR.
To tackle the rising inflation rate caused by the ongoing Russian invasion of Ukraine, after the first quarter of 2022, the Federal Reserve hiked the rate aggressively by more than five percentage points within 16 months.
Rupee
For a long period, India has been pushing INR to be accepted as a mode of payment for cross-border trades. As early as 1953, the then Union of Soviet Socialist Republics (USSR) and India signed the Rupee Trade Agreement to enable trade in local currencies.[5] The latest instance of such a push was showcased in July 2021. During the official visit of Sri Lankan President Ranil Wickremesinghe, the two countries adopted a ‘vision document’ meant to enhance economic ties between the two nations. The document also includes the provision for using India’s Unified Payments Interface (UPI) for cross-border transactions. Despite the efforts, this wouldn’t be able to bring any substantial success for INR, as Sri Lanka is not India’s major export destination. As per the 2022-23 annual report of the Indian Department of Commerce, among 19 nations that signed for bilateral trade settlements in Indian rupees,[6] only Bangladesh and the United Arab Emirates are on the list of top 10 export destinations for India.[7] Besides them, China is also on the list.
India-Bangladesh Trade
For FY 2019-20, India’s exports to Bangladesh were at 8.2 billion USD, and the imports were at 1.26 billion USD[8] Then, in FY23 (until February), New Delhi’s exports to Dhaka was at 10.63 billion USD (equivalent to 2.6 per cent of India’s total exports), and Bangladesh’sexport to India during the same period was at 1.86 billion USD (constituting 0.28 per cent of India’s overall imports).
These financial activities were recorded when Bangladesh’s economy faced soaring inflation, aggressive policy rate hikes, and slowing economic growth. Due to this, Dhaka had to implement substantial changes in its monetary policy. One such initiative was to address the trade balance deficit and deficit in the foreign currency circulation in the market. Dhaka sold foreign currencies in the open market from its reserve to address this situation. Even though it stabilised the market somewhat, Bangladesh’s foreign exchange reserves decreased from 41.83 billion USD in June 2022 to 31.14 billion USD in March 2023, which depreciated the value of Bangladeshi Taka (BDT).[9] Depreciating value impacts imports directly, which ripple impacts countries’ economies largely dependent upon imports. Dhaka is no exception, as for FY23, the Balance of Payment (BoP) deficit was 8.2 billion USD, whereas for FY22, the BoP deficit was 3.1 billion USD.[10]
Under this circumstance, it seems pragmatic for Bangladesh to limit its economy’s exposure to the risk associated with dollars. As of July 11, 2023, Dhaka has commissioned the use of the Indian Rupee (INR) for bilateral trade with New Delhi; thereby, Bangladesh Bank authorised three banks to establish nostro accounts with their counterparts in India.[11] Bangladesh and India enjoy a warm diplomatic relationship and strong economic bond, so the success of INR trade in Dhaka will appreciate the value of INR in the regional market. This would encourage Southeast Asian countries and other nations to undergo similar agreements. The success of INR trade with Dhaka pivots upon the possibility that India could increase its trade share with Bangladesh. For a long time, New Delhi was Dhaka’s top trading partner, but in 2015, Beijing claimed this position, and as of 2019, the People’s Republic of China (PRC) held 34 per cent of total Bangladesh’s imports.[12] Besides the change in trade dynamics, in 2016, Dhaka became a part of Beijing’s Belt and Road Initiative (BRI). This attracted a spike in FDI from the PRC. For FY 2018-19, the PRC invested 1159.42 million USD, whereas India invested 113.70 million USD, which is only 2.92 of the total FDI of that financial year.[13] In 2018, Bangladesh Bank allowed banks to open clearing accounts in the Chinese currency; further, in July 2020, the PRC granted a zero per cent preferential tax rate to almost all imported items whose point of origin is Bangladesh.[14]
For a long time, New Delhi was Dhaka’s top trading partner, but in 2015, Beijing claimed this position, and as of 2019, the People’s Republic of China (PRC) held 34 per cent of total Bangladesh’s imports.
India-UAE
Between 1970 and FY19-20, the bilateral trade between India and UAE increased from 180 million USD annually to 60 billion USD.[15] UAE and India signed a Comprehensive Economic Partnership Agreement (CEPA) that came into effect in May 2022, causing upward traction in the bilateral traction of the two countries. This year marked the first anniversary of CEPA. The agreement enhanced the bilateral trade by 14 per cent – as a valuation of trade for May 2021-March 2022 was at 67.5 billion USD; it grew to 76.9 billion USD for May 2020-March 2023.[16]
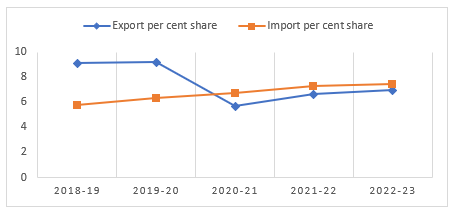
Line Graph comparing total export per cent with total import per cent in between FY2018-19 to FY2022-23 (source – Department of Commerce, Ministry of Commerce and Industry, Government of India)
As the graph represents, CEPA has not been able to bring any significant financial benefit to India. India’s total export per cent has been trailing behind imports for three consecutive financial years, i.e., since FY 2020-21. During the same financial year, the world faced the impact of covid. So, the drop in exports indicates that India’s meat packing and seafood industries are struggling to achieve their pre-COVID level since meat-based items and seafood occupy a major share in New Delhi’s exports to Abu Dhabi.
In contrast to India’s scenario, UAE-China bilateral trade relation has evolved rapidly, especially as Abu Dhabi became a part of BRI in 2018.[17] 1984 witnessed the inception of diplomatic relations between Abu Dhabi and Beijing, and since then, the value of bilateral trade has gone up from 63 billion USD in 1988 to 50 billion USD in 2018;[18] and by 2021, the value of bilateral trade has surpassed 75.6 billion USD.[19]
BRI also increase the inflow of Chinese FDI in the UAE. PRC is the third largest investor in the UAE, and as of the beginning of 2021, it invested 9.3 billion USD in Abu Dhabi.[20] However, in 2022, India’s investment in UAE stood at 545.52 million USD.[21] In the backdrop of these economic engagements, Abu Dhabi entered into a currency swap agreement with both India and China. In 2015, UAE and PRC entered the agreement, whose worth was 5.45 billion USD. Both countries further agreed to approve a quota of 7.75 billion USD to the UAE’s RMB Qualified Foreign Institutional Investor (RQFII) program.[22] Then, in 2018, India and UAE signed a currency swap agreement for 496 million USD.[23]
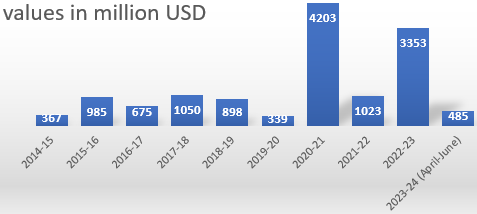
Bar graph representing the FDI inflow in India from UAE from FY2014-15 to FY2022-23 (April-June) (source – Department for Promotion of Industry and Internal Trade, Ministry of Commerce and Industry, Government of India)
Except for the FY2020-21 and FY2022-23, the value of FDI inflow has remained below or around 1000 million USD. FY2020-21 registered the highest in-flow, i.e., 4203 million USD. Despite these elaborative figures, Abu Dhabi is at 2.4889 per cent out of total FDI Equity inflow from April 2000 to June 2023.[24]
China’s Effort to Internationalise RMB
By the second half of 2011, RMB obtained a reserve portfolio in the Central bank of different nations, and Chile, Malaysia and Nigeria pioneered this trend.[25] Further, on Nov 30, 2015 International Monetary Fund (IMF) executive board voted to expand the Special Drawing Rights (SDRs) basket to include the RMB; the decision came into effect in October 2016.[26] Even though the inclusion in SDR does not directly impact the actual circulation of the concerned currency, RMB’s inclusion in the basket with a weight of 10.9 per cent shows its ascend in the global financial market and provides an imprimatur as an official reserve currency.[27]
Beijing first concentrated on making allies to achieve this position, which was possible because of its financial market’s breadth, depth and liquidity.[28] Later, the same international cohort influenced the IMF to change its pre-existing rules to accommodate RMB in SDR. For instance, during France’s presidency of G20, on multiple occasions of the G20 events, Paris highlighted the need to include RMB’s in the SDR basket.[29] It is important to analyse the steps taken by the PRC to improve the dimensions of its market.
Beijing first concentrated on making allies to achieve this position, which was possible because of its financial market’s breadth, depth and liquidity.
Liberalisation of the Chinese economy began with the third plenary meeting of the eleventh Central Committee of the Communist Party of China (CPC) in 1978.[30] This helped Beijing to attain 19th rank in the list of most-connected countries in 2017; the connectedness further solidified the PRC’s contribution to the global GDP. As of 2018, the PRC contributed 16 per cent of the world’s GDP. Opening up the Chinese economy was not the sole reason for the deep integration; other economic policies played their respective roles. For instance, the People’s Bank of China (PBC) has aggressively established bilateral swap agreements with other central banks. These channels were used to provide USD in exchange for the local currency of the counterpart economy; this changed in 2009[31] as PBC started to issue RMB in exchange for local currency. This type of arrangement attained a new height in 2013, as one of the G7 central banks, i.e., Bank of England, signed the agreement to establish a swap line with PBC.
The percentage of China’s external debt to GDP ratio has always been below 9 per cent. This started to go up in 2014 (during the same time BRI was incepted), and in 2022, it was at 13.641 per cent (in absolute figures, it is 2,452.8 bn USD).[32] Beijing’s financial assets grew exponentially; in 2019, it was 12.5 trillion USD 2019, and three-quarters of these assets account for public corporations.[33] This exhibits the stability of the PRC’s economic market, which is essential for establishing the bond market. The growth of the domestic market of RMB bonds has been exponential, as it grew from RMB 200 billion in 1997 to RMB 19 trillion in June 2010.[34] The RMB’s offshore bond, i.e., the dim sum bond market, was incepted in 2011, and Hong Kong SAR was the point of its beginning; thereby, the market attended its peak in 2015 when PBC issued a one-year dim sum bond in London whose value was 05 billion RMB.[35]
The PRC’s policies, like investing in foreign securities, support the expansion of dim sum bonds. For instance, PRC’s portfolio investment in the United States has spiked from 29 billion USD in 2007 to 320 billion USD in 2014.[36] Then, in 2020, Chinese investors held 700 billion USD in equity and 1.4 trillion USD in debt securities issued by the U.S.[37] Three schemes in Beijing support the flow of money in and out of the Chinese economy. Those are the Qualified Foreign Institutional Investor (QFII) Scheme,[38] Renminbi Qualified Foreign Institutional Investor (RQFII) Scheme[39] and the Qualified Domestic Institutional Investor (QDII) Scheme.[40] QFII was launched in 2002, and as of October 2015, the total quota under the scheme was 78.9 billion USD, which was granted to 277 foreign institutes, including eight central banks and ten sovereign wealth funds.[41] Then, in 2006, QDII was incepted, and as of November 2015, its total quota stands at 90 billion USD, which was granted to 132 financial institutions.[42] Finally, RQFII was incepted in 2011, and its total quota was 68.4 billion USD and was issued to 135 financial institutions.[43]
India’s Promotion Efforts
To achieve the internationalisation goal, India needs to expand its trading partners with whom it can sustain a trade surplus. New Delhi has been trying to expand its trading partners by engaging with regional alliances. A few instances of such alliances are SAARC (South Asian Association for Regional Cooperation),[44] BIMSTEC (Bay of Bengal Initiative for Multi-Sectoral Technical and Economic Cooperation)[45] and ASEAN (Association of Southeast Asian Nations)[46]. New Delhi’s outreach through SAARC has derailed due to the degrading bilateral relations with Pakistan,[47] SAARC’s last submission took place in 2014. So far, India has not been able to establish a strong trading relationship with the ASEAN countries, except Singapore. As of FY 2021-22, New Delhi’s export to Singapore was only 2.64 per cent of India’s total exports, whereas the import for the same financial year was 3.09 per cent of total imports.[48] In contrast, India has a trade surplus with the member nations of BIMSTEC.
India has not been able to establish a strong trading relationship with the ASEAN countries, except Singapore.
Besides the existing economic corridors, the India-Middle East-Europe Economic Corridor (IMEC) was announced during the G20 summit 2023, and India is a part of this corridor.[49] The corridor is expected to bring business and economic opportunities to India. However, among the signatory nations of the corridor,[50] India holds a trade surplus with none of them.
In the top-down approach of infusing liquidity into the economic market attracts foreign investors, the Government of India (GoI) and the Reserve Bank of India (RBI) have taken multiple steps. One such step is to issue a Rupee-based international bond, i.e. Masala Bond. In November 2014, the International Finance Corporation (IFC) issued an I000 core INR Bond listed on the London Stock Exchange (LSE).[51] In September 2015, RBI issued guidelines on September 29, 2015, allowing Indian companies, non-banking finance companies, infrastructure investment trusts, and real investment trusts to issue Masala bonds.[52]

Issuance of Masala bonds by Indian Companies (source- Institute for International Monetary Affairs, 2020)
Further, the RBI and Coorporate issues rupee bonds in the domestic market. In 1992, RBI began issuing government bonds to attract more private participation, by April 2006, RBI was restricted from participating in government bond auctions.[53] As of December 2019, outstanding bond issuance by the public sector stood at Rs 98 trillion, comprising Rs 68 trillion by government bonds (Rs 58 trillion for G-Sec., Rs 5 trillion for T-bills, and Rs 4 trillion for others), Rs 29 trillion by State Development Loans (SDL) issued by state governments, and Rs 2 trillion of UDAY bonds issued to resolve the debts of the state power distribution companies.[54]
In contrast to the size of the government bond market, the corporate market is limited in size. As of September 2019, the outstanding issuance amounted to Rs 31 trillion.[55]

Corporate Bond Issuance (source – Institute for International Monetary Affairs, 2020)
Besides bonds, the Government of India formulated policies to attract foreign investors through the policy of Foreign Direct Investment (FDI). In 2021-22, FDI inflow stood at 83.57 billion USD.
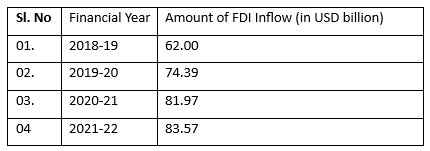
FDI inflows reported during the last four financial years (source – PIB, 2022)
In spite of all these efforts, so far, INR could not surpass the international acceptance of RMB. Since July 2023, Indian refiners have used RMB to settle some payments for Russian oil imports.[56]
Conclusion and Way Forward
The comparison of India and China’s economic and monetary policies helped us understand the shortcomings in New Delhi’s approach to internationalise INR. The country’s push to internationalise its local economy began before liberalising it. However, the Chinese economy’s breadth, depth, and liquidity are more than India’s, so it attracted more allies than New Delhi. Then, China used BRI to increase the acceptance of RMB and was able to do that because Beijing has a trade surplus with most BRI nations. In contrast, even though India is a part of different cross-border and international trade initiatives, it is still trying to promote substantial trade volume using INR. Further, the total economic volume combining bonds and FDI is less than the combined trade volume managed through both QFII and RQFII.
The Chinese economy’s breadth, depth and liquidity are more than India’s, so it attracted more allies than New Delhi.
India should focus on putting money where the mouth is. New Delhi needs to prioritise promoting trade through BIMSTEC. Further, it needs to transform its economy and reduce import dependency so New Delhi can infuse more liquidity into the market. As the liquidity increases, sovereign bonds, FDI, and other similar initiatives will attract more foreign investors. Currently, world nations are going through a phase of financial constraints. India should use this opportunity in its favour by helping small nations face problems with their foreign currency reserve. India could use its position to facilitate foreign reserve currencies in exchange for the respective nations’ local currencies, as China did initially. Finally, India’s domestic politics shouldn’t impact its economic and monetary policies, as sudden policy changes tend to drag down the international confidence in the economy.
Subhadip Mondal holds two master’s degrees. First, he completed an M. Tech in Geoinformatics from Central University of Jharkhand and then pursued an MA in Politics and International Relations from Pondicherry University. His research interest is International Political Economy, Science & Technology and Geopolitics. He has published multiple research articles. The two latest articles are ” Roar in the Valley: India’s G-20 Event in Kashmir and Addressing the Challenge of the China-India ICT Gap“.The views contained in this article are the author’s alone.
[1] “GDP of India: Current and Historical Growth Rate, India’s Rank in the World,” Forbes India, August 14, 2023, https://www.forbesindia.com/article/explainers/gdpindia/85337/1#:~:text=India’s%20nominal%20GDP%20or%20GDP,trillion)%20in%202021%2D22.
[2] “India’s Overall Exports Projected to Scale New Heights, Growing at 13.84 Percent during FY 2022-23 over FY 2021-22 to Achieve USD 770.18 Billion Worth of Exports,” Press Information Bureau, April 13, 2023, https://pib.gov.in/PressReleasePage.aspx?PRID=1916220.
[3] Taylor Tepper, “Federal Funds Rate History 1990 to 2023,” Forbes, July 26, 2023, https://www.forbes.com/advisor/investing/fed-funds-rate-history/.
[4] “Foreign Investors Pull out Record $18 Billion from 8th Largest Stock Market in 2022,” Moneycontrol, December 07, 2022, https://www.moneycontrol.com/news/business/markets/worlds-best-performing-large-stock-market-is-set-to-see-record-foreign-outflows-9657891.html.
[5] “Reviving Economic Interests,” Frontline, October 13, 2000, https://frontline.thehindu.com/cover-story/article30255131.ece.
[6] Rajiv Ranjan Singh, “Bangladesh Joins Rupee Cohort, Sign Deals to Settle Trade in Rupees,” Fortune India: Business News, Strategy, Finance and Corporate Insight, April 27, 2023, https://www.fortuneindia.com/macro/bangladesh-joins-rupee-cohort-sign-deals-to-settle-trade-in-rupees/112442.
[7] “Annual Report 2022-23,” Department of Commerce, accessed October 04, 2023, https://commerce.gov.in/wp-content/uploads/2023/03/Annual-Report-FY-2022-23-DoC.pdf.
[8] “India-Bangladesh Bilateral Relations,” Ministry of External Affairs, accessed October 02, 2023, https://www.mea.gov.in/Portal/ForeignRelation/India_Bangladesh_MAR2021.pdf.
[9] “Moneytary Policy Review 2022-23,” Bangladesh Bank, accessed October 04, 2023, https://www.bb.org.bd/pub/halfyearly/monetaryprev/mpr_dec_2021.pdf.
[10] Idem.
[11] Anand Kumar, “India–Bangladesh Trade Settlement in Indian Rupee,” Manohar Parrikar Institute for Defence Studies and Analyses, August 18, 2023, https://www.idsa.in/issuebrief/india-bangladesh-trade-akumar-180823#:~:text=In%20its%20effort%20to%20lessen,starting%20from%2011%20July%202023.
[12] Anwar Anu, “China-Bangladesh Relations: A Three Way Balance between China, India and the US,” Merics, August 18, 2022, https://merics.org/en/china-bangladesh-relations-three-way-balance-between-china-india-and-us#:~:text=China%20is%20gaining%20ground%20in,Bangladesh’s%20total%20imports%20in%202019.
[13] Foreign Direct Investment (FDI) in Bangladesh, accessed October 04, 2023, https://bb.org.bd/pub/halfyearly/fdisurvey/fdisurveyjanjun2019.pdf.
[14] M. S. Siddiqui, “Monetary Cooperation between Bangladesh and China,” The Business Post, November 23, 2022, https://businesspostbd.com/editorial/2022-11-23/monetary-cooperation-between-bangladesh-and-china.
[15] “Comprehensive Economic Partnership Agreement (CEPA) between India and the United Arab Emirates (UAE) Unveiled,” Press Information Bureau, March 07, 2022, https://pib.gov.in/PressReleasePage.aspx?PRID=1810279.
[16] “CEPA Is the Growth Engine for India-UAE Bilateral Trade,” Press Information Bureau, May 01, 2023. https://pib.gov.in/PressReleasePage.aspx?PRID=1921222.
[17] Christoph Nedopil Wang, “Green Finance & Development Center,” Green Finance Development Center, 2023, http://www.greenfdc.org/.
[18] “China and the UAE Enjoy Economic and Trade Cooperation,” The State Council Information Office, July 19, 2018, http://english.scio.gov.cn/infographics/2018-07/19/content_57794337.htm.
[19] Giulia Interesse, “Why the UAE Is a Key Economic Partner for China and Its BRI Ambitions,” China Briefing News, August 31, 2022, https://www.china-briefing.com/news/china-united-arab-emirates-uae-bilateral-trade-investment-outlook/.
[20] “UAE and China Discuss Investment Opportunities in New Economic Sectors, Trade, Transportation & Technology,” Ministry of Economy UAE, March 19, 2023, https://www.moec.gov.ae/en/-/uae-and-china-discuss-investment-opportunities-in-new-economic-sectors-trade-transportation-technology.
[21] Isaac John, “UAE Is Fourth Largest Investor in India in FY23,” ZAWYA, June 16, 2023, https://www.zawya.com/en/world/indian-sub-continent/uae-is-fourth-largest-investor-in-india-in-fy23-qrb6b1cd.
[22] “China Extends Currency Swap Agreement with UAE,” China extends currency swap agreement with UAE – Business – Chinadaily.com.cn, December 14, 2015, http://www.chinadaily.com.cn/business/2015-12/14/content_22710922.htm.
[23] “UAE and India Sign 35 Billion Rupees Currency Swap Agreement,” Reuters, December, 04, 2018, https://www.reuters.com/article/emirates-india-currency-swap-idINKBN1O31VT.
[24] “QUARTERLY FACT SHEET FACT SHEET ON FOREIGN DIRECT INVESTMENT (FDI) INFLOW; FROM APRIL, 2000 to JUNE, 2023. FDI Statistics,” Department for Promotion of Industry and Internal Trade, June 2023, https://dpiit.gov.in/sites/default/files/FDI_Factsheet_June_23.pdf.
[25] “2021 Annual Report to Congress of the U.S.-CHINA ECONOMIC AND SECURITY REVIEW COMMISSION,” U.S.-China Economic and Security Review Commission, November 2021, https://www.uscc.gov/sites/default/files/2021-11/2021_Annual_Report_to_Congress.pdf.
[26] Idem.
[27] Idem.
[28] Breadth: The availability of a broad range of financial instruments, including markets for hedging risk. Depth: A large volume of financial instruments in specific markets. Liquidity: A high level of turnover (trading volume).
[29] “2021 Annual Report to Congress of the U.S.-CHINA ECONOMIC AND SECURITY REVIEW COMMISSION,” U.S.-China Economic and Security Review Commission, November 2021, https://www.uscc.gov/sites/default/files/2021-11/2021_Annual_Report_to_Congress.pdf.
[30] Ross Garnaut, Ligang Song, and Cai Fang, “China’s 40 Years of Reform and Development : 1978–2018,” OAPEN Home, April 01, 2020. https://library.oapen.org/handle/20.500.12657/29458.
[31] “2021 Annual Report to Congress of the U.S.-CHINA ECONOMIC AND SECURITY REVIEW COMMISSION,” U.S.-China Economic and Security Review Commission, November 2021, https://www.uscc.gov/sites/default/files/2021-11/2021_Annual_Report_to_Congress.pdf.
[32] “China External Debt: % of GDP,” CEIC Data, accessed October 04, 2023, https://www.ceicdata.com/en/indicator/china/external-debt–of-nominal-gdp.
[33] W. R. Lam, and M. Moreno-Badia, (working paper), “Fiscal Policy and the Government Balance Sheet in China” (1–55), International Monetary Fund.
[34] B. N. Lohani, “Launch of offshore renminbi bonds. Asian Development Bank,” (2018, February 06), https://www.adb.org/news/speeches/launch-offshore-renminbi bonds#:~:text=Since%20the%20first%20off%2Dshore,corporation%20and%20a%20foreign%20entity.
[35] “2021 Annual Report to Congress of the U.S.-CHINA ECONOMIC AND SECURITY REVIEW COMMISSION,” U.S.-China Economic and Security Review Commission, November 2021, https://www.uscc.gov/sites/default/files/2021-11/2021_Annual_Report_to_Congress.pdf.
[36] Ibid.
[37] Adam Lysenko, Mark Witzke, Thilo Hanemann, and Daniel H. Rosen, “US-China Financial Investment: Current Scope and Future Potential,” National Committee on US-China Relations, January 2021, https://rhg.com/wp-content/uploads/2021/01/US-China-Financial-Investment_25Jan2021-2.pdf.
[38] Allows qualified foreign institutions to convert foreign currency into RMB and invest in Chinese equities (both A shares and B shares) and a range of other RMB-denominated financial instruments.
[39] Allows qualified institutions to use offshore RMB funds to invest in Chinese equities and a range of other RMB-denominated financial instruments.
[40] Allows qualified institutions to use offshore RMB funds to invest in Chinese equities and a range of other RMB-denominated financial instruments.
[41] “2021 Annual Report to Congress of the U.S.-CHINA ECONOMIC AND SECURITY REVIEW COMMISSION,” U.S.-China Economic and Security Review Commission, November 2021, https://www.uscc.gov/sites/default/files/2021-11/2021_Annual_Report_to_Congress.pdf.
[42] Idem.
[43] Idem.
[44] The South Asian Association for Regional Cooperation (SAARC) was established with the signing of the SAARC Charter in Dhaka on December 08, 1985. SAARC comprises eight Member States: Afghanistan, Bangladesh, Bhutan, India, Maldives, Nepal, Pakistan and Sri Lanka. For more: https://www.saarc-sec.org/index.php/about-saarc/about-saarc.
[45] Initially known as BIST-EC (Bangladesh-India-Sri Lanka-Thailand Economic Cooperation), the organisation is now known as BIMSTEC and comprises seven Member States, with the admission of Myanmar on December 22, 1997, and Bhutan and Nepal in February 2004. For more: https://bimstec.org/bimstec-history/.
[46] ASEAN, an abbreviation for the Association of Southeast Asian Nations, is a political and economic union of 10 states in Southeast Asia. For more: https://asean.org/.
[47] Suparna Karmakar, “Reimagining India’s Engagement with BIMSTEC,” Observer Research Foundation, September 2020, https://www.orfonline.org/wp-content/uploads/2020/09/ORF_IssueBrief_404_ReimaginingBIMSTEC_NEW.pdf.
[48] “Annual Report 2022-23,” Department of Commerce, accessed October 04, 2023, https://commerce.gov.in/wp-content/uploads/2023/03/Annual-Report-FY-2022-23-DoC.pdf.
[49] “Partnership for Global Infrastructure and Investment (PGII) & India-Middle East-Europe Economic Corridor (IMEC),” Press Information Bureau, September 09, 2023, https://pib.gov.in/PressReleseDetail.aspx?PRID=1955921.
[50] Saptaparno Ghosh, “What Purpose Does the India-Middle East-Europe Economic Corridor (IMEC) Serve?: Explained,” The Hindu, September 16, 2023, https://www.thehindu.com/news/international/what-purpose-does-the-india-middle-east-europe-economic-corridor-imec-serve-explained/article67302606.ece.
[51] “Masala Bonds,” Consulate General of India, August 31, 2016, https://www.cgihamburg.gov.in/pdf/press/Masala_Bonds_pst_080916.pdf.
[52] Suparna Karmakar, “Reimagining India’s Engagement with BIMSTEC,” Observer Research Foundation, September 2020, https://www.orfonline.org/wp-content/uploads/2020/09/ORF_IssueBrief_404_ReimaginingBIMSTEC_NEW.pdf.
[53] “The Bond Market in India,” Institute for International Monetary Affairs, March 2020, https://www.iima.or.jp/en/docs/newsletter/2020/nle2020.4.pdf.
[54] Idem.
[55] “Partnership for Global Infrastructure and Investment (PGII) & India-Middle East-Europe Economic Corridor (IMEC),” Press Information Bureau, September 09, 2023, https://pib.gov.in/PressReleseDetail.aspx?PRID=1955921.
[56] Shivangi Acharya, and Riddhima Talwani, “Indian Refiners Used Yuan to Pay for Some Russian Oil Imports, Official Says,” Reuters, July 14, 2023, https://www.reuters.com/world/india/india-cenbank-give-banks-guidance-resolve-rupee-trade-issues-official-2023-07-14/#:~:text=India-,Indian%20refiners%20used%20yuan%20to%20pay,Russian%20oil%20imports%2C%20official%20says&text=NEW%20DELHI%2C%20July%2014%20.